F-IF Graphing Stories
Alignments to Content Standards:
F-IF.B.4
Task
In this activity we will investigate the relationship between different quantities that are shown in a series of 10 video clips. Each clip includes a real time part, half speed playback, and a possible solution. (This allows students to make an initial sketch, adjust their sketch, and validate their results.)
For each video clip, watch the first part showing the situation in real time and then stop. At that point, sketch a graph of the relationship demonstrated on the set of graphs provided. In each graph pay special attention to key features such as increasing and decreasing intervals, maximums and minimums, intercepts, and constant and variable rates of change.
After drawing the initial sketch, watch the second part of the video showing the situation in half speed to double check your graph and revise it as appropriate.
Compare and discuss your graph with a neighbor or a different group. When you have reached an agreement of what the graph should look like, watch the last part of the video to see a possible solution. Did it agree with your graph? What was different, what was similar?
The ten video clips are below:
1)
2)
3)
4)
5)
6)
7)
8)
9)
10)
IM Commentary
The purpose of this task is to have students represent each indicated relationship of a given variable vs. time graphically with special attention to representing key features of increasing and decreasing intervals (videos #1 and #5), maximums and minimums (videos #1 and #5), intercepts (all videos), and constant and variable rates of change (all videos).
Opportunities to focus on SMP’s:
SMP 3- Constructing viable arguments and critiquing the reasoning of others
-
Pause each video between full speed and half speed clips and have students explain to a partner their first attempts at graphing each situation focusing on connecting features of the graph to occurrences in the video clip. Partners can ask clarifying questions to challenge presenter’s reasoning.
SMP 4- Mathematical Modeling
-
Have students identify variables and determine appropriate units.
-
Pausing after full speed to give students time to complete sketches before playing half speed allows students to validate their models of the situation, improving the model if they feel it is warranted.
SMP 6- Attending to precision
-
Students should use mathematically accurate vocabulary to describe key features of their graphs and connect their graphs to the context of each video clip.
Student work for Video 2 is shown in:
https://drive.google.com/file/d/0B6AE_k7mJ0JIM3E2NGJqd0k3NnM/view?usp=sharing
Coordinate axes that can be used with this task:
https://drive.google.com/file/d/0B6AE_k7mJ0JIY0oxcTRCenM1OW8/view?usp=sharing
This task was originally developed by Dan Meyer and discussed in his blog at http://blog.mrmeyer.com/2007/graphing-stories/ .
Solution
Video Synopsis, Discussion Questions, and Solutions:
To emphasize the need to interpret the situation from the graph, draw all discussion and arguments from the graphs, not the videos. Students should justify reasoning based on the graph, not the video clip.
Video #1- Man walking over an arched bridge, pausing at the top to look over the rail. https://drive.google.com/file/d/0B6AE_k7mJ0JILWMwWTkwV0pYb0k

Discussion Questions:
-
Why does the graph start and end so far above the time axis?
-
At what time and for how long does the man stop to look over the rail? How does your graph reflect that?
-
Where is the slope of the graph positive/negative? Why?
-
When does he reach the highest point on the bridge? How do you know?
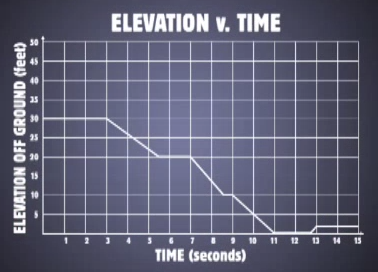
Video #2- Man walking down three flights of stairs with a landing between each, then stepping up onto a sidewalk.
https://drive.google.com/file/d/0B6AE_k7mJ0JIX0Qzc1ZSYk9EbEk
Discussion Questions:
-
Where is the slope of the graph positive/negative/neither? What does a negative slope represent in the video? What does a positive slope represent in the video?
Video #3- Man coming down a ladder out of an attic, pausing to take a drink of soda, then walking into a kitchen.
https://drive.google.com/file/d/0B6AE_k7mJ0JIc1RFbGdZOHhuQWc

Discussion Questions:
-
Because of the similarity between this video and video #2, this video could be used as an opportunity for students to check for understanding. In pairs, have students describe their graphs to each other in the context of the video.
Video #4- Man hopping up and down to different heights and at different speeds.
https://drive.google.com/file/d/0B6AE_k7mJ0JIZm1FamtyeW9hRUE

Discussion questions:
-
How is this graph similar to the previous 3? How is it different?
-
When does the man jump the highest?
-
How does the “shape” of his jumps change when he jumps higher or lower?
-
When does he jump the highest? How do you know?
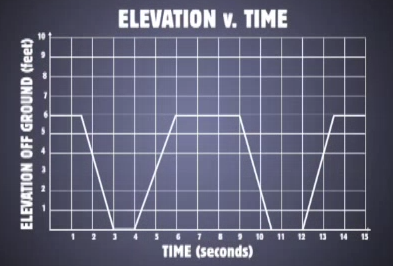
Video #5- Man going down one set of steps then up another set twice.
https://drive.google.com/file/d/0B6AE_k7mJ0JIMzF4dGZId2s3WTg
Discussion Questions:
-
How long does it take the man to do one “lap” (down one side and back up the other)?
-
How does the graph of his first lap compare to that of his second lap?
-
How high is he when the video starts? How high when it ends? How do you know?
Video #6- Man hammering in nails, then hitting his thumb.
https://drive.google.com/file/d/0B6AE_k7mJ0JIZUN4VkxVbVQ4alk

Discussion Questions:
-
Good place to discuss units. What units could we use to measure pain? Are there set units for pain? What do doctors use?
-
What does the end of the graph look like?
-
What might the graph look like if he hit his thumb earlier, then put it in ice?
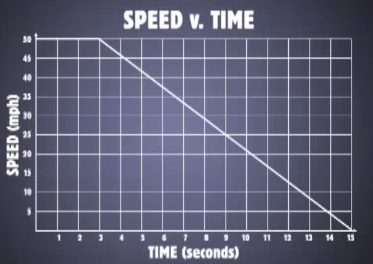
Video #7- Speedometer of a car as the driver applies the brakes.
https://drive.google.com/file/d/0B6AE_k7mJ0JIVzFqQzFOOUdMLWs
Discussion Questions:
-
When does the driver begin braking? (Use your graph)
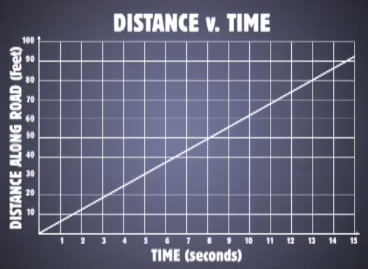
Videos 8, 9, and 10 are the same clip of a man running up a curving road.
Video #8
https://drive.google.com/file/d/0B6AE_k7mJ0JIWEtEZlA0cVZpZFE

Video #9
https://drive.google.com/file/d/0B6AE_k7mJ0JIUEJoZi1FYzBsSms

Video #10
https://drive.google.com/file/d/0B6AE_k7mJ0JIWmNrNnlSLWxFbFk
Discussion Questions:
-
How are these three graphs the same? How are they different?
-
When is the runner running the fastest? When is he running slowest?
-
When has he run halfway up the hill?
-
What other graphs could we make using this same video?
F-IF Graphing Stories
In this activity we will investigate the relationship between different quantities that are shown in a series of 10 video clips. Each clip includes a real time part, half speed playback, and a possible solution. (This allows students to make an initial sketch, adjust their sketch, and validate their results.)
For each video clip, watch the first part showing the situation in real time and then stop. At that point, sketch a graph of the relationship demonstrated on the set of graphs provided. In each graph pay special attention to key features such as increasing and decreasing intervals, maximums and minimums, intercepts, and constant and variable rates of change.
After drawing the initial sketch, watch the second part of the video showing the situation in half speed to double check your graph and revise it as appropriate.
Compare and discuss your graph with a neighbor or a different group. When you have reached an agreement of what the graph should look like, watch the last part of the video to see a possible solution. Did it agree with your graph? What was different, what was similar?
The ten video clips are below:
1)
2)
3)
4)
5)
6)
7)
8)
9)
10)