Adding Base Ten Numbers, Part 3
Alignments to Content Standards:
6.NS.B.3
Task
In the picture below, a small square represents a unit, a long, thin rectangle represents a bundle of ten units, and a large square represents ten bundles of ten units. A small square can represent any number we want.
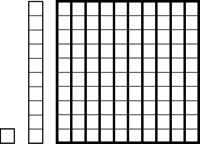
So for example, if the small square represents 1,000, then the diagram below represents 243,000:

Draw a picture that represents each of the following sums. What number does a unit represent in your picture? What about a bundle of ten units? What about ten bundles of ten? Make sure you can see both addends and the sum in your picture. For each problem, use two colors: one for each addend.
- 0.016 + 0.082
- 0.029 + 0.034
- 0.043 + 0.017
- 0.081 + 0.045
- 0.056 + 0.044
IM Commentary
This is the third in a set of three tasks generalizing the addition algorithm shown below from whole numbers to all base-ten numbers. [Part 1, Part 2, Part 3]
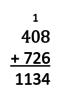
The purpose of this particular task is to give meaning to the "carry" we do when we add using this algorithm by casting it in terms of bundling units into groups of ten. The fact that the diagrams can be used to represent any two or three digit base-ten number supports understanding that the steps in the algorithm work for any places in a base ten number as long as we are adding the digits that are in the same place. In principle, students have seen these kinds of diagrams in earlier grades, but if these representations are new to students, they might need to work with whole numbers first and have more scaffolding to understand how they can represent decimals.
The five problems are carefully sequenced to illustrate some different nuances in regrouping. This task would be most effective if all students completed all parts (rather than splitting up the work).
Note that students can draw the diagrams quickly if they have small-grid graph paper and colored pencils. The teacher can speed up the time it takes for students to do this task by demonstrating how to draw a diagram like this on graph paper, perhaps by using a document camera. Here is ">a desmos simulation that dynamically shows the representation used in this task.
After these three tasks, it would be appropriate for the teacher to present this algorithm in general and explain why it works for any base-ten number.
Solution
For all of the diagrams shown, a unit represents 0.001, a bundle of ten units represents 0.01, and ten bundles of ten units represents 0.1.
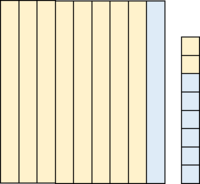
- 0.016 + 0.082 = 0.098. The first addend is shaded blue in the diagram and the second addend is shaded yellow. You can see 9 bundles of ten units and 8 units, so you can see the sum in the diagram as well.
- 0.029 + 0.034 = 0.063. The first addend is shaded blue in the diagram and the second addend is shaded yellow. You can see 6 bundles of ten units and 3 units, so you can see the sum in the diagram as well.

- 0.043 + 0.017 = 0.06 (or 0.060). The first addend is shaded blue in the diagram and the second addend is shaded yellow. You can see 6 bundles of ten units, so you can see the sum in the diagram as well.

- 0.081 + 0.045 = 0.126. The first addend is shaded blue in the diagram and the second addend is shaded yellow. You can see 1 bundle of ten bundles of ten units, 2 bundles of ten units, and 6 units, so you can see the sum in the diagram as well.

- 0.056 + 0.044 = 0.1 (or 0.100). The first addend is shaded blue in the diagram and the second addend is shaded yellow. You can see 1 bundle of ten bundles of ten units, so you can see the sum in the diagram as well.

Adding Base Ten Numbers, Part 3
In the picture below, a small square represents a unit, a long, thin rectangle represents a bundle of ten units, and a large square represents ten bundles of ten units. A small square can represent any number we want.
So for example, if the small square represents 1,000, then the diagram below represents 243,000:
Draw a picture that represents each of the following sums. What number does a unit represent in your picture? What about a bundle of ten units? What about ten bundles of ten? Make sure you can see both addends and the sum in your picture. For each problem, use two colors: one for each addend.
- 0.016 + 0.082
- 0.029 + 0.034
- 0.043 + 0.017
- 0.081 + 0.045
- 0.056 + 0.044