Containers
Alignments to Content Standards:
F-IF.B.4
Task
Here are 6 containers that are being filled with water at a constant rate, and 9 graphs that represent the height of the water in a container as a function of the volume of water in the container.
- Choose the graph that corresponds to each container.
- Explain your reasoning clearly.
- For the remaining 3 graphs, sketch what the containers could look like.


IM Commentary
The purpose of the task is to help students think about how two quantities vary together in a context where the rate of change is not given explicitly but is derived from the context. Students relate the width of the container to how quickly or slowly the height changes as water is added at a constant rate. In all cases the height increases as water is added. In order to distinguish the graphs for different containers, students have to think about the rate at which the height of the water increases as the volume increases. In the classroom, teachers could ask students to work in pairs to construct arguments for matching the containers to the graphs and creating the additional three containers. After sufficient time, pairs can form teams to compare their results and critique each other’s reasoning. Students have the opportunity to reason abstractly and quantitatively, going from the physical context to the mathematical model and back again to decide how quickly or slowly height increases as the volume increases. The teacher can extend the task in several ways:
- How would the graph change for a container similar to the original container but smaller (or larger) in size?
- How would the graph change if the container has a stem?

- How would the graph for the container pictured on the right be different from the others?

- How would the graph change if the container were filled with flowers?
- How would the graph change if we plotted volume vs. height?
Solution
If water is flowing at a constant rate into a part of the container whose cross-section is the same at all heights, like the bottom part of the Ink Bottle or the top part of the Evaporating Flask, then the height is increasing at a constant rate, and so the corresponding part of the graph is linear. Moreover, if the vessel is wide the height increases at a slower rate than if it is narrow, so the corresponding part of the graph is steeper. If the cross section is changing in width, then the corresponding part of the graph is not linear. With these principles in mind we can distinguish the graphs by identifying parts where they linear or non-linear and by matching those parts to parts of the container.
The Bucket and the Conical Flask do not have any part with constant cross-section, so the corresponding graphs do not have any part that is linear. This rules out graphs (b), (c), The Bucket widens as you go up, so the height increases quickly at first and then slowly, corresponding to graph (a). Similarly, the Conical flask fills slowly and then quickly as shown in graph (d).
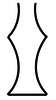
The Vase fills slowly then quickly then slowly, which is shown in graph (e) with the curve starting out less steep, then getting steeper, and then getting less steep again.
The Plugged funnel shares some similarity with the Bucket, but starts out with a constant rate of change, because the width of the bottom part is constant. The corresponding part of the graph is steep because the stem of the funnel is narrow and fills quickly. Graph (b) starts out with a constant rate of change, with a steep linear segment, and then levels out with decreasing rate of change like graph (a) for the bucket.
The Ink Bottle shares some similarity with the Conical flask, but starts and ends with parts that have constant width, and therefore the graph starts and ends with parts that are linear. The bottom part is wider than the bottom part of the Funnel, so that part of the graph is not as steep as the other part. There is a non-linear part of the graph in between the two linear parts, corresponding to the part of the Ink Bottle where it narrows. Graph (g) fits all these features.
The change in height for increase in volume of the Evaporating flask will be fast, slow, fast again, and then constant. The constant rate of change will correspond to steep linear segment on the graph to show that the top of the flask fills quickly. The graph which shows this best is (i).
A container for graph (h) will fill slowly then quickly then slowly then quickly. It might look like the vase that is shown with an additional top part that looks like the bottom half of the vase.
A container for graph (c) fills at a fast constant rate of change and then a slow constant rate of change, as shown in the container below.

A container for graph (f) will fill slowly and then quickly, as shown in the container below.

Containers
Here are 6 containers that are being filled with water at a constant rate, and 9 graphs that represent the height of the water in a container as a function of the volume of water in the container.
- Choose the graph that corresponds to each container.
- Explain your reasoning clearly.
- For the remaining 3 graphs, sketch what the containers could look like.