The Addition Rule
Alignments to Content Standards:
S-CP.B.7
Task
Consider the population consisting of the students at a high school who are members of the student council.
A diagram can be used to visualize this population. To construct such a diagram, a rectangle is drawn to represent the population, and each student on the student council is represented by a labeled point in the rectangle.
Here is the diagram for this population:

-
How many students are on this student council?
-
The given diagram also represents the sample space for the chance experiment of selecting a student at random from this population. For this chance experiment, what is the probability that student K is selected? Justify your answer.
-
In a diagram, an event can be represented by a shape (often a circle or oval) that encloses the outcomes that make up the event. Consider the following events:
F= the event that the selected student is a freshman
S = the event that the selected student is a sophomore
J = the event that the selected student is a junior
Which of the following diagrams could be a representation of these three events? Explain your choice.
Diagram 1
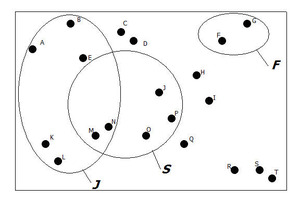
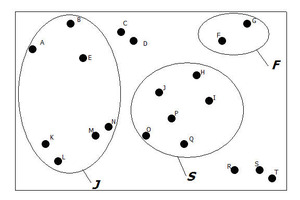
Diagram 2
Use Diagram 2 above to answer questions d – f.
-
If a student is selected at random from the council, what is P(J), the probability that the selected student is a junior? Justify your answer.
-
Is P(F) = P(J)? Explain why or why not.
-
Use Diagram 2 to find the following probabilities:
a.P(F)
b.P(S)
c.P(F or S)
Now consider Diagram 3 shown below. This diagram contains the two events
J = event that the selected student is a junior
M = event that the selected student is male
Diagram 3

-
Shade the region where the two ovals overlap. What event is represented by this shaded region?
-
Use Diagram 3 to find the following probabilities:
a.P(J)
b.P(M)
c.P(J or M)
d.P(J and M)
-
Explain why P(F or S) = P(F) + P(S)(see question 6) but P(J or M) ≠ P(J) + P(M).
-
Can you come up with a way to calculate P(J or M) using the other three probabilities calculated in question h? Write this as a formula in the form
P(J or M) =
-
Explain why your formula in question j makes sense in terms of Diagram 3.
-
In general, suppose A and B are two events. Write a formula for calculating P(A or B) in each of the following two cases:
Case 1:A and B are mutually exclusive (A and B have no outcomes in common)
Case 2:A and B are not mutually exclusive
-
The formula for Case 2 in question l is called the General Addition Rule. This rule also works for calculating P(A or B) when A and B are mutually exclusive. Explain why this is the case.
-
Write a sentence or two explaining how to calculate the probability of the union of two events.
IM Commentary
The purpose of this task is to provide practice calculating probabilities in the context of a chance experiment with equally likely outcomes and to allow students to develop the addition rule for calculating the probability of the union of two events. (S.CP.1, S.CP.7).
This task can be done by students working alone or you might have students work in pairs to complete this task. After students have had a chance to complete questions a – c, you might want to have the class discuss why Venn diagram 1 can not be correct for the events described. This will give you the opportunity to make sure that students understand the diagram as a representation of the sample space for a chance experiment and that they understand how events are represented.
After students have completed question k, you could complete the remaining questions as a class. This will give an opportunity to make sure that students understand the addition rule for mutually exclusive events as a special case of the general addition rule.
Solution
-
Each student is represented by a dot in the diagram, so there are 20 students on the council.
-
The probability that student K is selected is 1/20 = 0.05 because there are 20 possible outcomes and the outcomes are equally likely. Only one of these outcomes corresponds to student K being selected.
-
Diagram 2 could be a representation of these three events. Diagram 1 is not possible, because two outcomes (M and N) are in both events J and S. Since it is impossible for a student to be both a junior and a senior, diagram 1 could not be correct for the three events given.
-
Because there are 7 outcomes in this event and the outcomes are equally likely, P(J) = 7/20 = 0.35.
-
No, P(F) = 2/20 = .10. The number of outcomes is not the same for these two events.
-
a.P(F) = 2/20 = 0.10
b.P(S) = 6/20 = 0.30
c.P(F or S) = 8/20 = 0.40
-
The region where the two ovals overlap corresponds to the event that the selected student is both male and a junior.
-
a.P(J) = 7/20 = 0.35
b.P(M) = 6/20 = 0.30
c.P(J or M) = 11/20 = 0.55
d.P(J and M) = 2/20 = 0.10
-
The events F and S do not have any outcomes in common, so the total number of outcomes in the union is just the sum of the number of outcomes in the two individual events. The events J and M do have outcomes in common, so if you add the number of outcomes in the two individual events, you would count some outcomes twice.
-
P(J or M) = P(J) +P(M) – P(J and M)
-
If you add the probabilities P(J) +P(M), the probability of outcomes that are in both J and M is included twice—once as a part of P(J) and once and part of P(M). Subtracting out P(J and M) corrects for this double counting.
-
Case 1: P(A or B) = P(A) +P(B)
Case 2:P(A or B) = P(A) +P(B) – P(A and B)
-
The Case 2 formula would also work for events that are mutually exclusive, because for events that are mutually exclusive there would be no overlap and P(A and B) = 0.
-
If two events are mutually exclusive, you can calculate the probability of their union by just adding the individual event probabilities. If two events are not mutually exclusive, you can calculate the probability of the union by adding the individual event probabilities and then subtracting the probability of the intersection of the two events.
The Addition Rule
Consider the population consisting of the students at a high school who are members of the student council.
A diagram can be used to visualize this population. To construct such a diagram, a rectangle is drawn to represent the population, and each student on the student council is represented by a labeled point in the rectangle.
Here is the diagram for this population:
-
How many students are on this student council?
-
The given diagram also represents the sample space for the chance experiment of selecting a student at random from this population. For this chance experiment, what is the probability that student K is selected? Justify your answer.
-
In a diagram, an event can be represented by a shape (often a circle or oval) that encloses the outcomes that make up the event. Consider the following events:
F= the event that the selected student is a freshman
S = the event that the selected student is a sophomore
J = the event that the selected student is a junior
Which of the following diagrams could be a representation of these three events? Explain your choice.
Diagram 1
Diagram 2
Use Diagram 2 above to answer questions d – f.
-
If a student is selected at random from the council, what is P(J), the probability that the selected student is a junior? Justify your answer.
-
Is P(F) = P(J)? Explain why or why not.
-
Use Diagram 2 to find the following probabilities:
a.P(F)
b.P(S)
c.P(F or S)
Now consider Diagram 3 shown below. This diagram contains the two events
J = event that the selected student is a junior
M = event that the selected student is male
Diagram 3
-
Shade the region where the two ovals overlap. What event is represented by this shaded region?
-
Use Diagram 3 to find the following probabilities:
a.P(J)
b.P(M)
c.P(J or M)
d.P(J and M)
-
Explain why P(F or S) = P(F) + P(S)(see question 6) but P(J or M) ≠ P(J) + P(M).
-
Can you come up with a way to calculate P(J or M) using the other three probabilities calculated in question h? Write this as a formula in the form
P(J or M) =
-
Explain why your formula in question j makes sense in terms of Diagram 3.
-
In general, suppose A and B are two events. Write a formula for calculating P(A or B) in each of the following two cases:
Case 1:A and B are mutually exclusive (A and B have no outcomes in common)
Case 2:A and B are not mutually exclusive
-
The formula for Case 2 in question l is called the General Addition Rule. This rule also works for calculating P(A or B) when A and B are mutually exclusive. Explain why this is the case.
-
Write a sentence or two explaining how to calculate the probability of the union of two events.