Guess The Probability
Alignments to Content Standards:
S-IC.A.2
Task
An instructor in a classroom of 40 students gave each of the 40 students a bag of 10 chips. In each bag, some of the 10 chips were red, and the rest were white. The bags were made of a thick cloth so that no one could see inside the bags, and all of the bags were identical in terms of their contents.
Each student was asked to remove one chip from his or her bag and to raise his or her hand if that chip was red. The number of reds for the entire class was recorded for that iteration. All students then placed their chips back in their bags, and the process was repeated 31 more times. The classroom results, a summary table, and a dotplot summarizing the results are as follows:

1) Below are 4 histograms that show the expected probability distribution of the variable “number of reds in 40 trials” based on 4 different probability assumptions regarding the red chips. (Note: these graphs are generated based on something called a binomial distribution.)
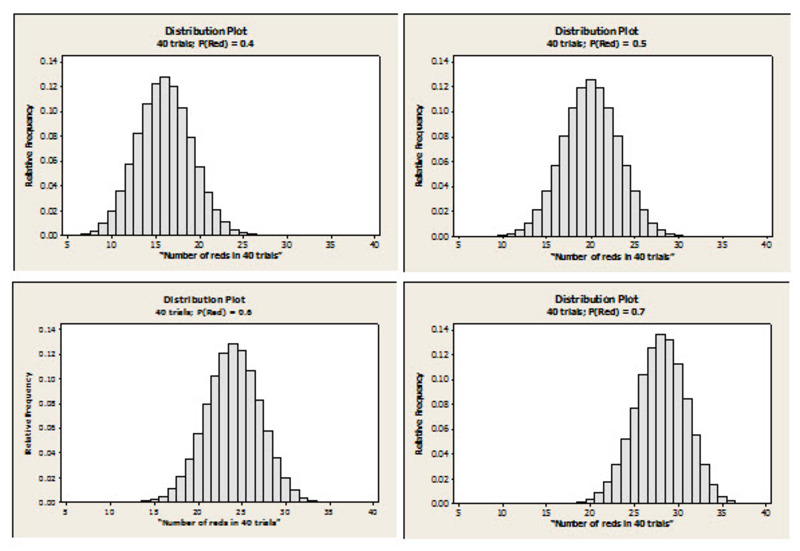
Using the class results as shown in the dotplot as a guide, compare the dotplot to these probability histograms and determine which of the 4 values for P(Red) (i.e., .40, .50, .60, or .70) was most likely the correct probability for the bags the instructor used in her class. Explain your choice of probability by commenting on the graphical features of these distributions, specifically mentioning those features that “fit” your choice of probability and those graphical features that eliminated other choices for you.
IM Commentary
This exercise is intended to have students note that repeated random sampling of the same sample size from the same population yields results that are in line with model expectations (yet perhaps not perfectly aligned with model expectations when only a limited number of sampling iterations occur). Moreover, students should note that there is variability in random sampling even when all sampling steps are applied consistently. Ultimately, students should be able to discuss whether it is realistic to assume that the bags are “60% red” based on the comparison of their dotplot with the histogram models using established terms of center, variability, and shape.
Some students may be concerned by the variability in the results of the 32 iterations, and it could be that some students say that 32 iterations are not enough to provide convincing evidence for choosing a particular model. One free web applet that could allow for more iterations and/or would allow the execution of the simulation on a bigger scale (and with an interesting context) appears at http://www.rossmanchance.com/applets/OneProp/OneProp.htm?candy=1
Solution
1) The probability used in the activity was P(Red) = .60 (i.e., 6 reds and 4 whites in each bag.). The class results were unimodal, slightly skewed left, and centered around 24 or 25 "reds” with a minimum of 19 and a maximum of 29.
Anticipate that students will say that they think that the number of red chips in the bag is 6. The explanations that students give for choosing this model will vary, but look for the following key points:
- The “60% red” distribution comes closest to the classroom data in terms of center, shape, maximum and minimum.
- While the “70% red” distribution has a similar shape to the class dotplot, it has a center, maximum, and minimum that are all much higher than the corresponding values developed from the class. Likewise, the “40% red” and “50% red” distributions have a center, maximum, and minimum that are all much lower than the corresponding values developed from the class.
Guess The Probability
An instructor in a classroom of 40 students gave each of the 40 students a bag of 10 chips. In each bag, some of the 10 chips were red, and the rest were white. The bags were made of a thick cloth so that no one could see inside the bags, and all of the bags were identical in terms of their contents.
Each student was asked to remove one chip from his or her bag and to raise his or her hand if that chip was red. The number of reds for the entire class was recorded for that iteration. All students then placed their chips back in their bags, and the process was repeated 31 more times. The classroom results, a summary table, and a dotplot summarizing the results are as follows:
1) Below are 4 histograms that show the expected probability distribution of the variable “number of reds in 40 trials” based on 4 different probability assumptions regarding the red chips. (Note: these graphs are generated based on something called a binomial distribution.)
Using the class results as shown in the dotplot as a guide, compare the dotplot to these probability histograms and determine which of the 4 values for P(Red) (i.e., .40, .50, .60, or .70) was most likely the correct probability for the bags the instructor used in her class. Explain your choice of probability by commenting on the graphical features of these distributions, specifically mentioning those features that “fit” your choice of probability and those graphical features that eliminated other choices for you.