The Aquarium
Alignments to Content Standards:
F-IF.B.4
Task
PART 1:
Below is an illustration of an aquarium. When the faucet is on, the water flows into the aquarium at a constant rate. When the plug is pulled out, the water drains at a constant rate (but slower than the faucet's rate). At various times some events happen that affect the water level and/or the rate at which the water level changes.

Draw a graph of the water level as a function of time for each of the following situations:
- The aquarium is initially empty with the plug in, and water flows in at a constant rate for 10 minutes.
- The aquarium is initially half full with the plug in. Nothing happens for 5 minutes, then somebody pulls the plug.
- The aquarium is half full and then a bucket of water is dumped into the aquarium.
- There is a rock in the half-filled aquarium for the first 7 minutes, then it is removed.
- The aquarium is initially empty and then the water faucet is turned on with the plug out.
PART 2:
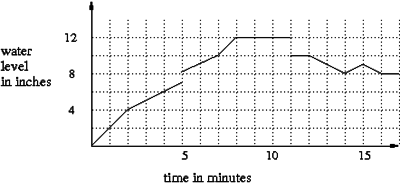
The graph below shows the height of the water in the aquarium over a 17-minute time interval. Write a story from the point of view of someone watching what is going on with the aquarium to produce the given graph. Be creative! Invent a story that fits the graph. (Or: Write a story and then have a classmate produce the graph that goes with it.)
PART 3:
The graph given above is a simplified version of reality. What simplifying assumptions did we make when we created the graph?
IM Commentary
The purpose of this task is to connect graphs with real life situations. Graphs tell a story. Specific features of a graph connect to specific features of a story. A point on a graph captures a specific instant in the story.
There is a progression of complexity in the task. It starts by describing specific events and asks the student to draw a graph for the given situation. While some specifics are given, for example the time that the water faucet is on, other quantities are not given and the students have to make choices themselves. For example, the rate of water flow is not given, therefore, we don’t have a scale for the output axis and the slope of the graph cannot be uniquely determined. There is a connection between the slopes of the graphs in 1, 2 and 5 (faucet on & plug in - faucet off & plug out - faucet on & plug out). Students have to choose their own scale on the vertical axis to accurately reflect the connections between the three graphs.
In part 2 the situation turns around. Now a graph of a situation is given and the students have to interpret the graph as a whole and invent a story line. This part also gives the students a chance to be creative.
Part 3 points out different aspects of modeling that are apparent in the task. The graph is a simplification of real life. Students might discuss that when a rock is pulled out of the aquarium, the volume of the hands and arms in the water will cause an increase in the water level before it drops. Also, the drop would not be a real discontinuity since the rock is pulled out over a short time period and does not just de-materialize.
During the first part of the task, we are also making a number of choices. Time periods, water flow rates, sizes of rocks and buckets are not always given. So we have to make many choices when drawing the graphs. However, even though different students' graphs will look different, the important qualitative features of the graph will be similar, e.g., a constant slope followed by a negative slope.
Instructors can choose which parts of the tasks they want to use. For example, only using Part 2 often leads to a very productive classroom discussion without preloading student knowledge. It would also make sense to do Part 2 first and then Part 1 as a follow-up or assessment. Part 2 can also stand on its own. Or students could do Part 1 as a pre-assessment and then be given the chance to revise their work after teamwork and classroom discussion for Part 2.
Many variations of the task are possible, including students writing stories and having other students draw the corresponding graphs.
Solution
PART 1:
Note that each part has many possible solutions. We only show one possible solution for each scenario. Also, the units on the vertical axis are not given in the problem. They are just for comparison and illustrative purposes.
- The aquarium is initially empty with the plug in, and water flows in at a steady rate for 10 minutes.

- The aquarium is initially half full with the plug in. Nothing happens for 5 minutes, then somebody pulls the plug.

- The aquarium is half full and then a bucket of water is dumped into the aquarium.
 (The sudden step is a simplification. This is discussed in Part 3.)
 - There is a rock in the aquarium for the first 7 minutes, then it is removed.
 (The sudden step is a simplification. This is discussed in Part 3.)
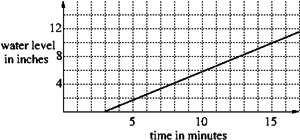
 - The aquarium is initially empty and then the water faucet is turned on with the plug out.
PART 2:
Beth got an aquarium for her birthday and is getting it ready for her two goldfish on her back porch. She got a water hose out, put in the plug and started to fill the aquarium with water. Unfortunately she wasn’t paying attention for a few minutes and the plug came loose and water started to drain out of the aquarium. Beth didn’t notice that this happened and just became impatient because it took so long for the aquarium to fill. So she went into the house and filled a bucket with water and dumped it into the aquarium after 5 minutes.
Two minutes later, Beth finally noticed the loose plug and put it back in. By now the water depth has reached 12 inches and Beth turns of the water hose. She is looking at her aquarium that has a big decorative rock in it and decides that she doesn’t really like the rock that is in there and pulls it out.
After trying to lift the aquarium to move it inside, Beth sees that she’ll splash water all over the place because it is too heavy and awkward. So she decides to drain some water out and pulls the plug. She turns her back for a couple of minutes and notices that her little brother has turn on the water hose. So she turns it off and waits another minute for the water that had been added to drain out.
Once the water level reaches 8 inches Beth decides that it is safe to move the aquarium inside and puts in the plug again.
PART 3:
The graph is a simplification of real life. Here are a few possible simplifications that can be discussed:
- When a rock is pulled out of the aquarium, the volume of the hands and arms in the water will cause an increase in the water level before it drops.
- The drop would not be a real discontinuity since the rock is pulled out over a short time period and does not just de-materialize.
- Similarly, when the bucket of water is dumped in, really the water level is at least somewhat turbulent and changes chaotically, while its average rate of change is very rapid.
- When the rock is in the aquarium, the water depth will change at different rates depending on whether the rock is completely covered or not.
The Aquarium
PART 1:
Below is an illustration of an aquarium. When the faucet is on, the water flows into the aquarium at a constant rate. When the plug is pulled out, the water drains at a constant rate (but slower than the faucet's rate). At various times some events happen that affect the water level and/or the rate at which the water level changes.
Draw a graph of the water level as a function of time for each of the following situations:
- The aquarium is initially empty with the plug in, and water flows in at a constant rate for 10 minutes.
- The aquarium is initially half full with the plug in. Nothing happens for 5 minutes, then somebody pulls the plug.
- The aquarium is half full and then a bucket of water is dumped into the aquarium.
- There is a rock in the half-filled aquarium for the first 7 minutes, then it is removed.
- The aquarium is initially empty and then the water faucet is turned on with the plug out.
PART 2:
The graph below shows the height of the water in the aquarium over a 17-minute time interval. Write a story from the point of view of someone watching what is going on with the aquarium to produce the given graph. Be creative! Invent a story that fits the graph. (Or: Write a story and then have a classmate produce the graph that goes with it.)
PART 3:
The graph given above is a simplified version of reality. What simplifying assumptions did we make when we created the graph?